
VivoTraq
VivoTraq gives your team one browser-based place to review animal temperature data, study context, and history. Pair it with VivoTraq Connect for live data and real-time alerts.
- Browser dashboards
- Real-time alerts
- Multi-site
See What Needs Attention
VivoTraq puts temperature trends, study details, animal records, and alert status in one browser workspace. With VivoTraq Connect, new scans arrive as they happen.
- Live Data Analytics VivoTraq Connect uploads new scans automatically, so your team can review current data from the browser.
- Study Aware Add animals, groups, and events to give temperature data the context your team needs.
- Real-Time Alerts Set global or label-specific temperature ranges and get notified when a reading falls outside them.
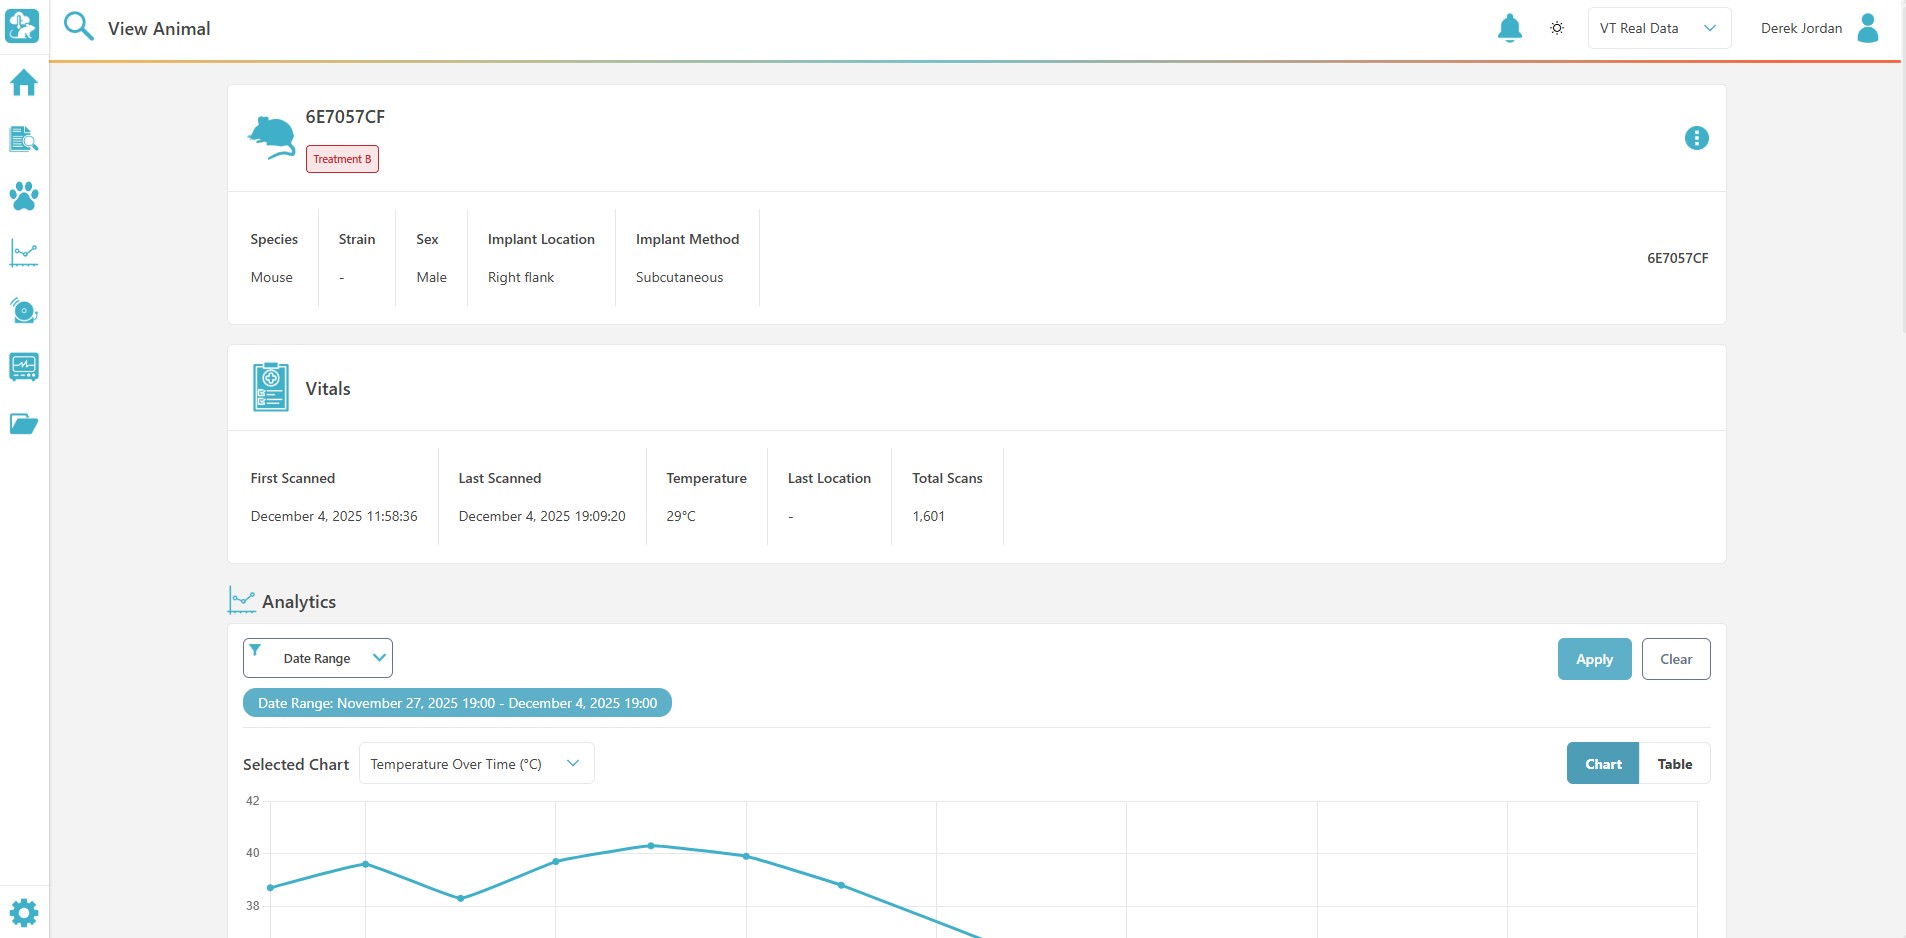
- Animal History Open an animal to see its vitals, temperature trends, study assignments, events, and record history.
- 24/7 Live monitoring with Connect
Everything the Team Needs to Monitor Your Study
- Know sooner With VivoTraq Connect, an out-of-range temperature reading can alert the team before the next room check.
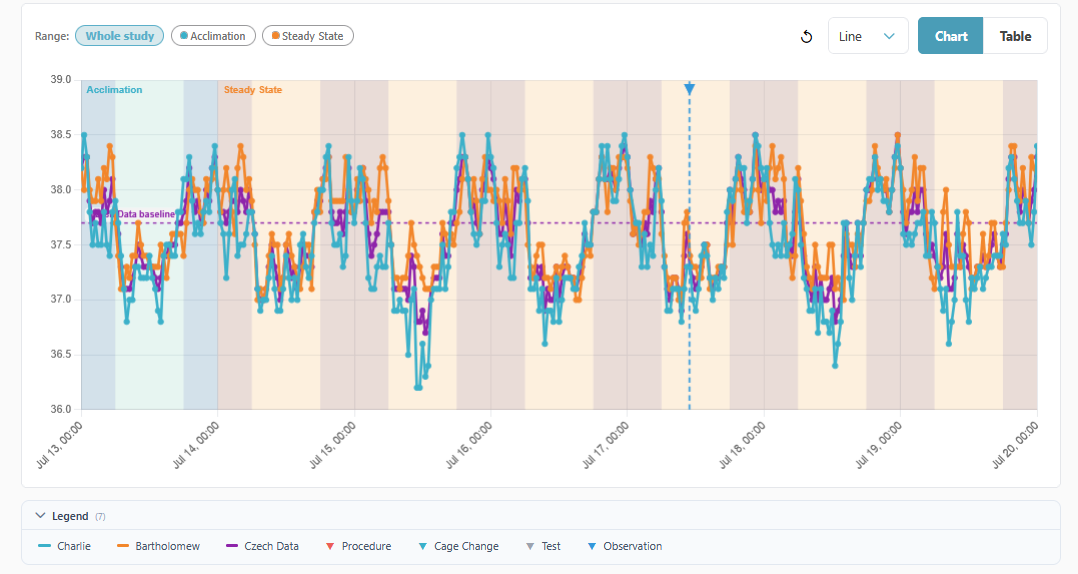
- Light/dark cycles Charts automatically shade the detected light and dark cycles, so no one has to tag them by hand.
- One animal record Each animal's scans, trends, study details, and changes stay together in a single record.
- One account Move between locations from the same account while each site keeps its own users and data.
- Ready for review Open a time-stamped history of who changed what without piecing it together from separate logs.
- Excel export Export a study to an Excel workbook with its charts included, ready for your next analysis step.
Have a Look Around VivoTraq
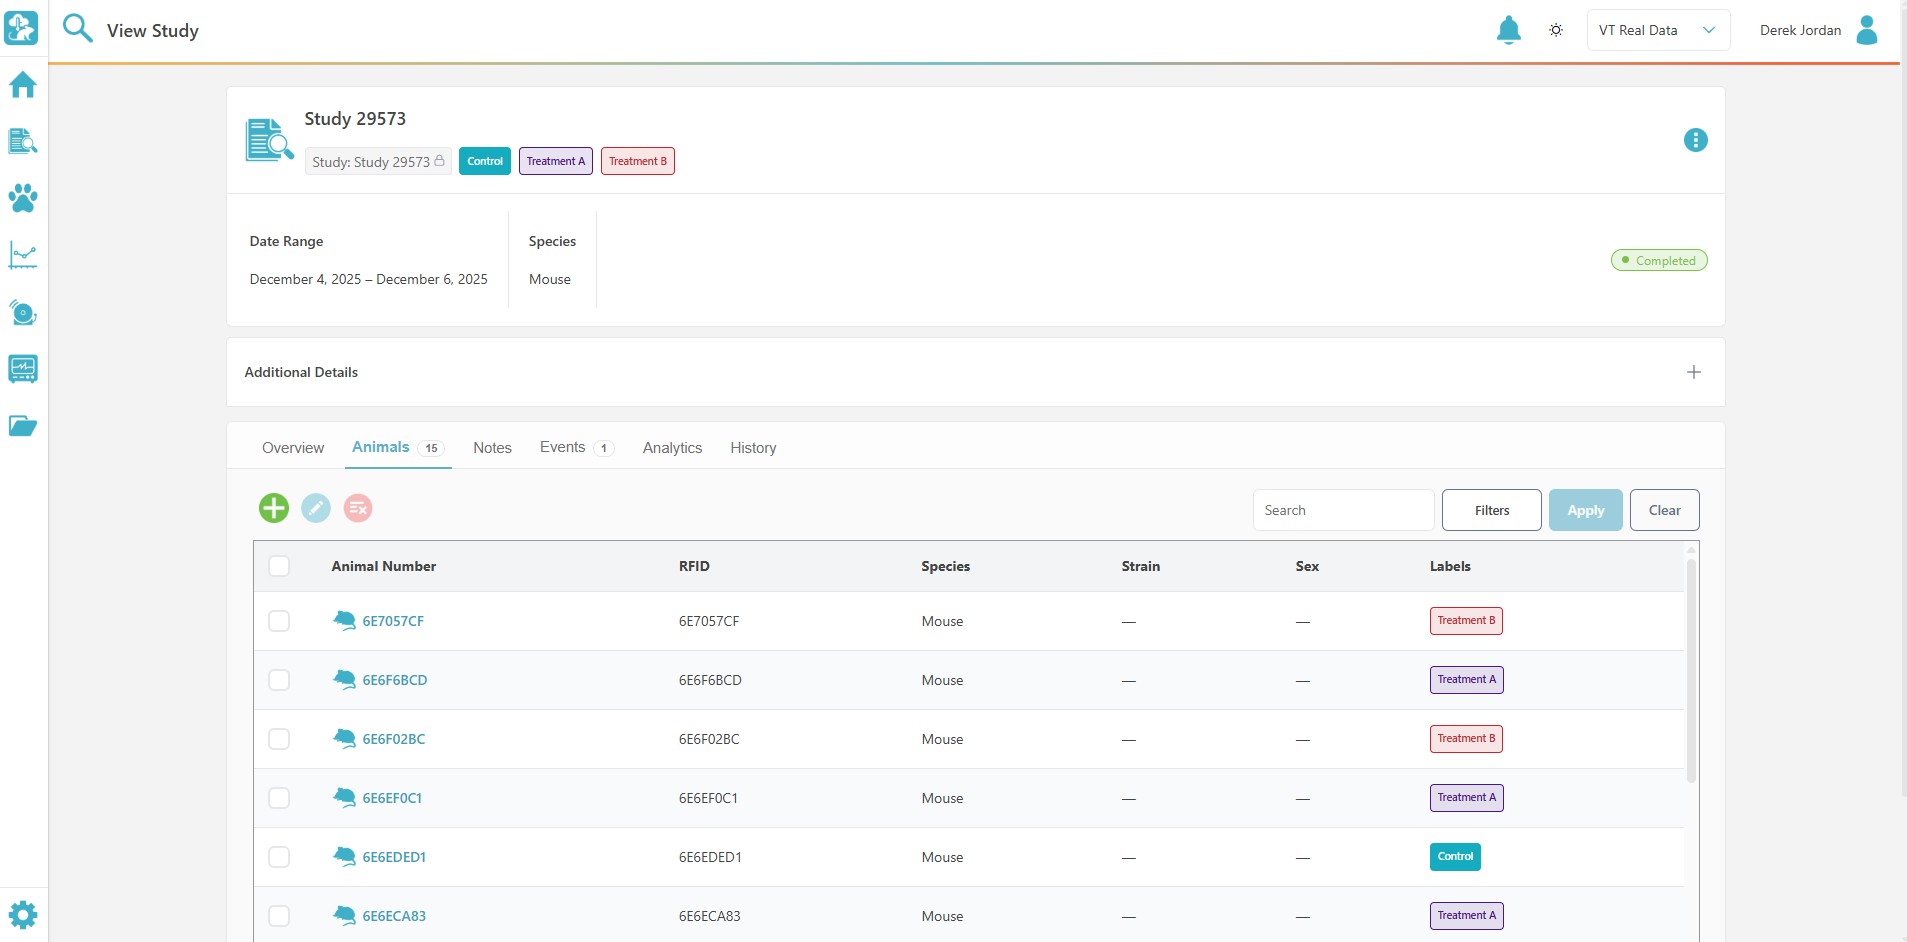
See every animal in the study, with RFID, strain, sex, and treatment group in one roster.
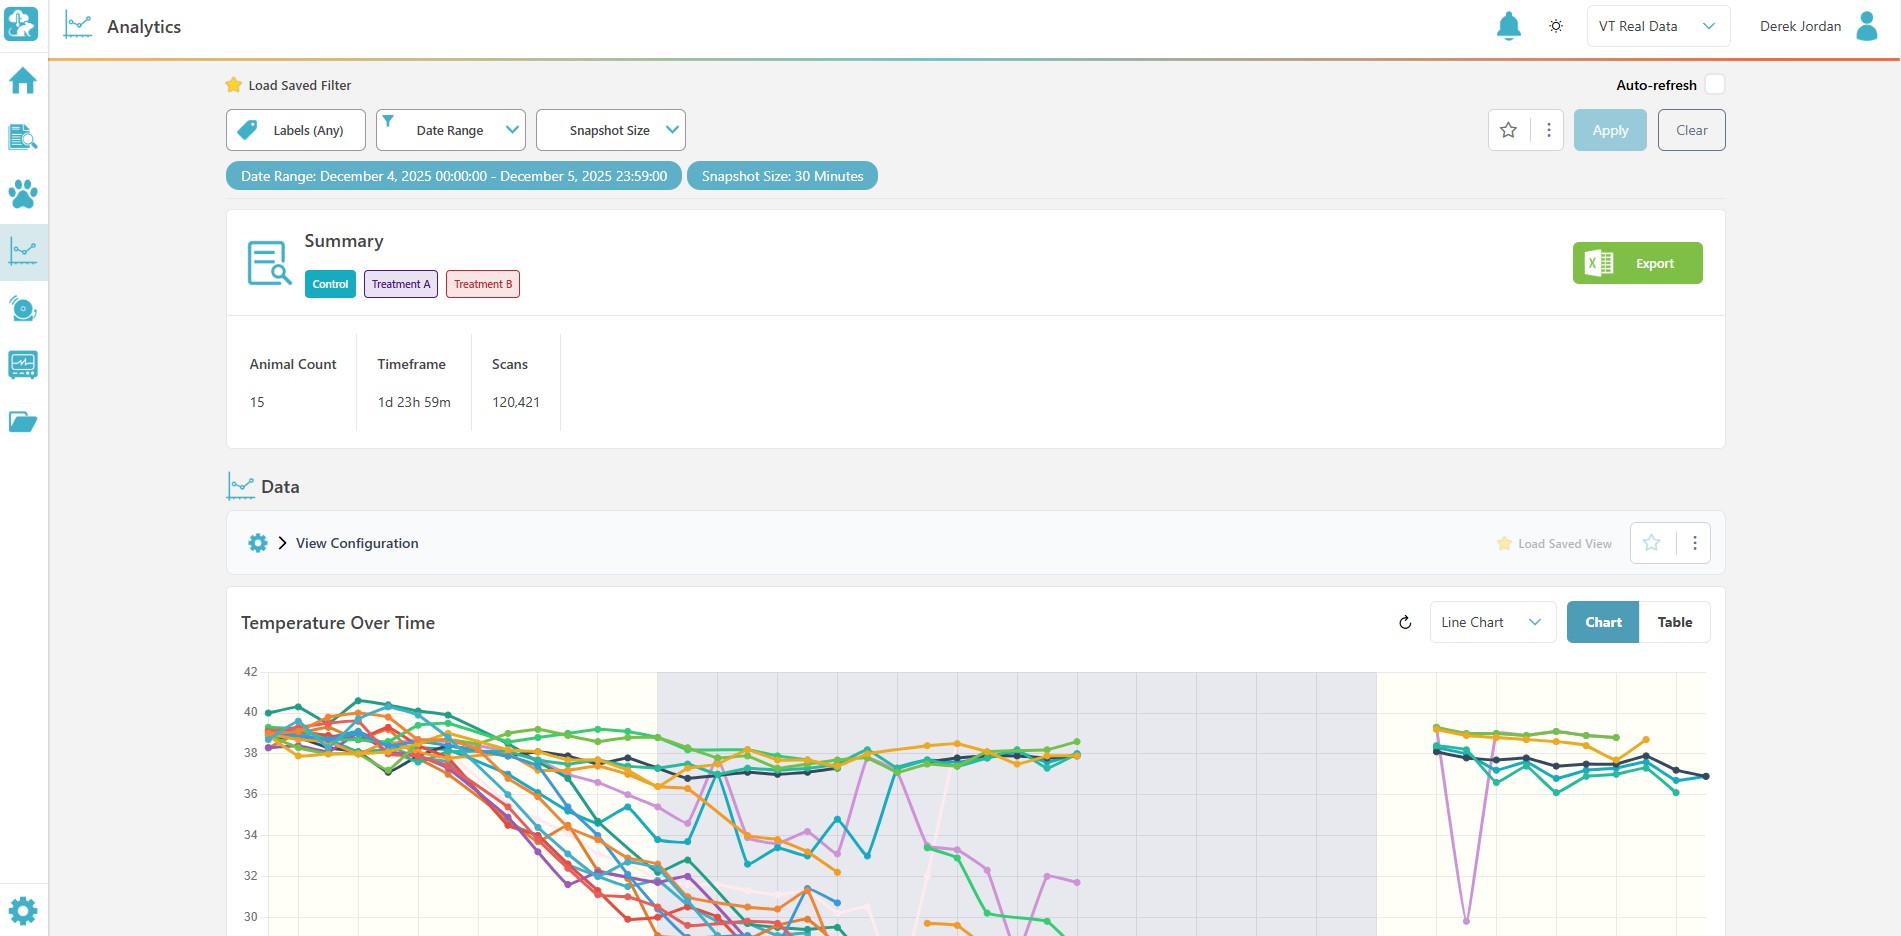
Filter by label and date range, review temperature as a chart or table, and export to Excel.
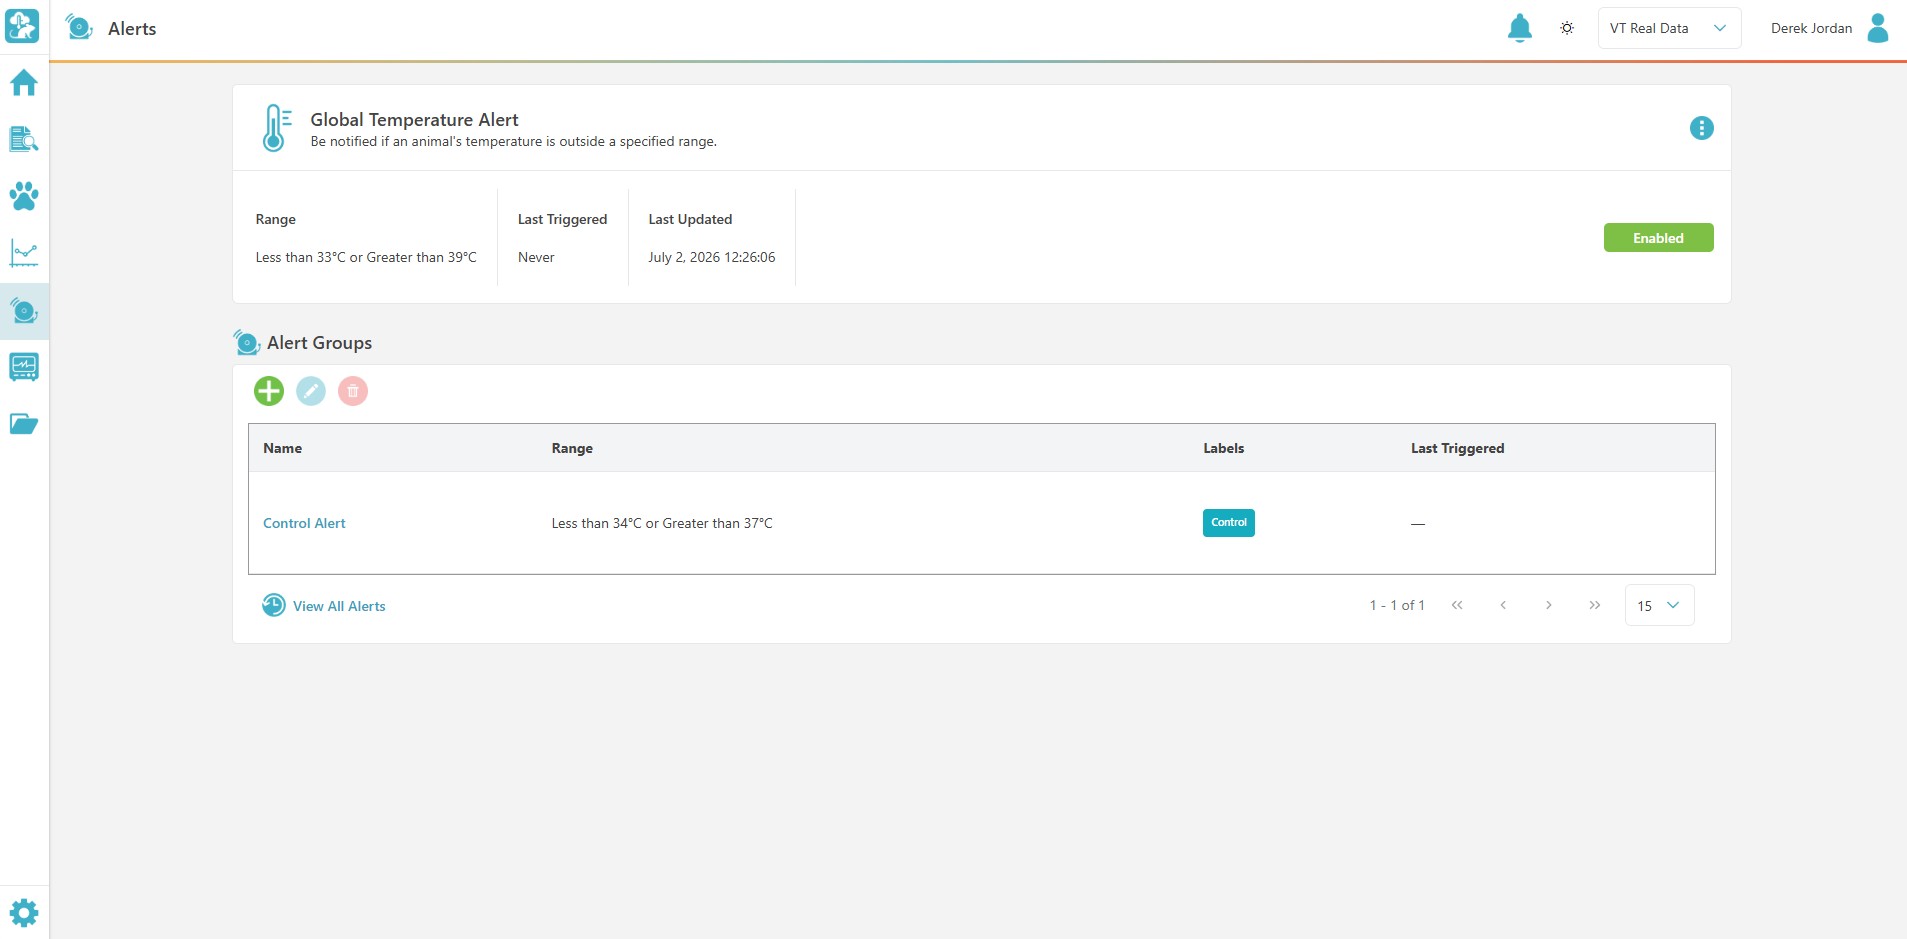
Set a global range or label-specific ranges, then see when each alert last triggered.
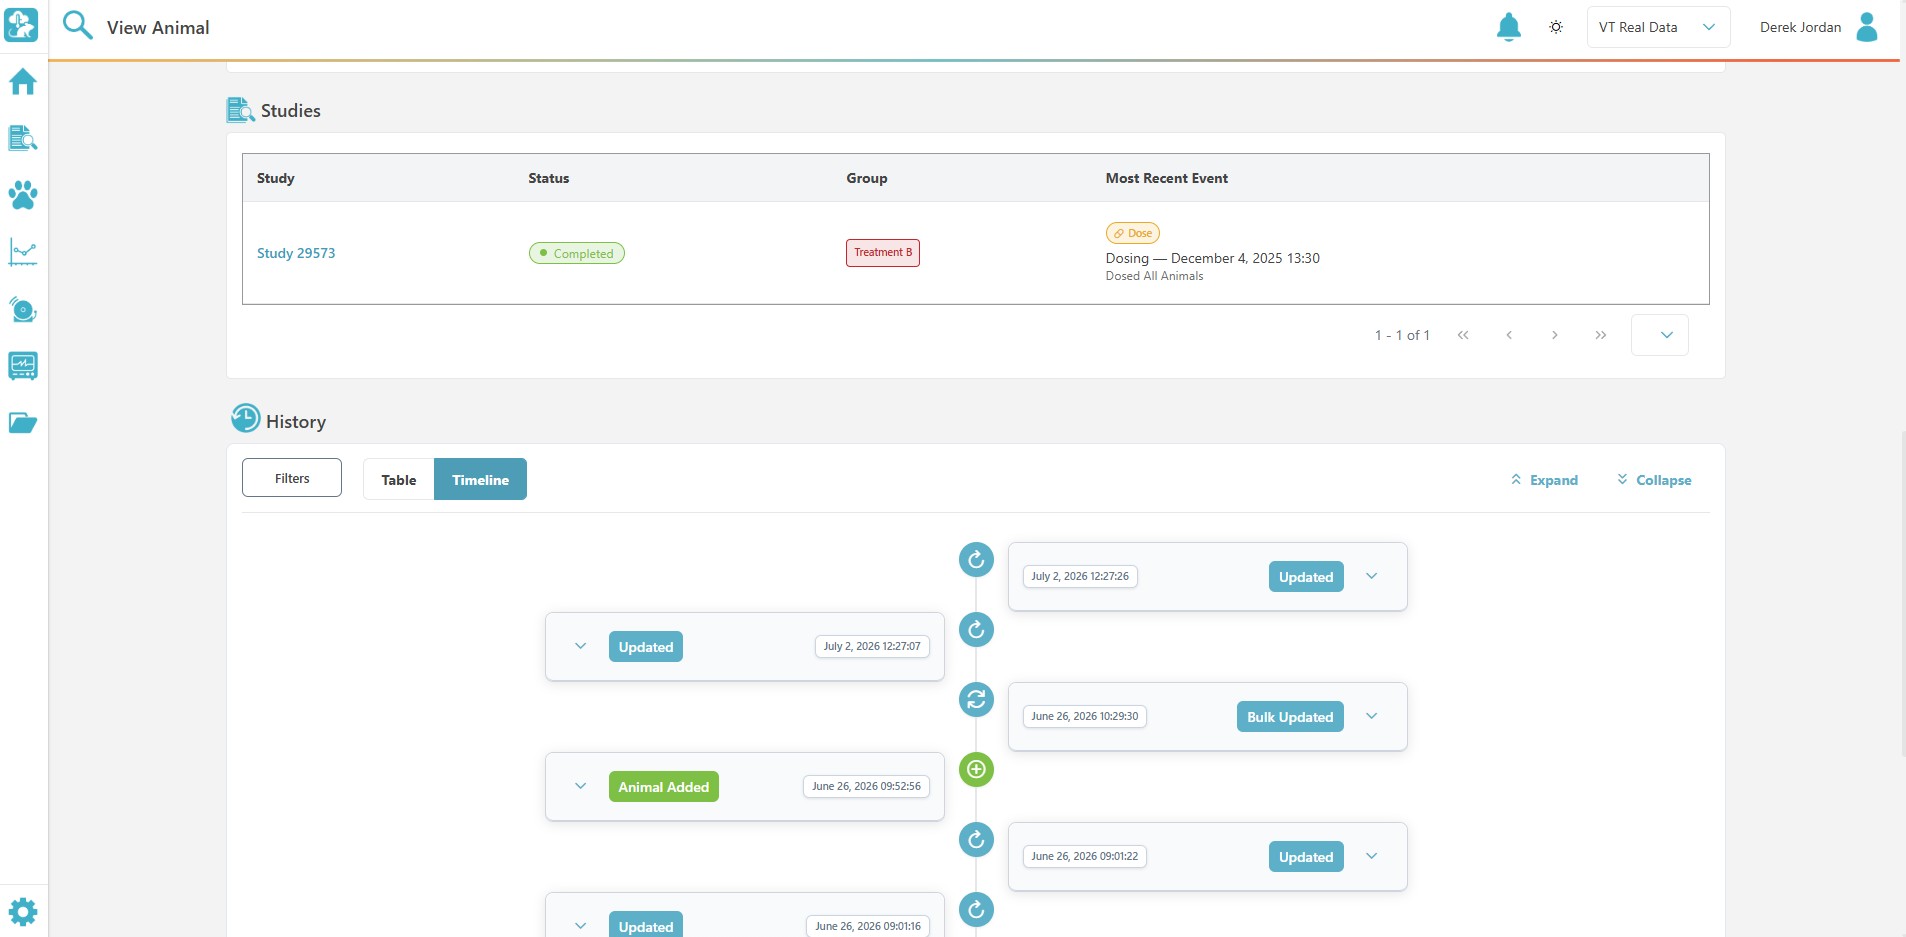
See study assignments and a time-stamped record of animal changes in a table or timeline.
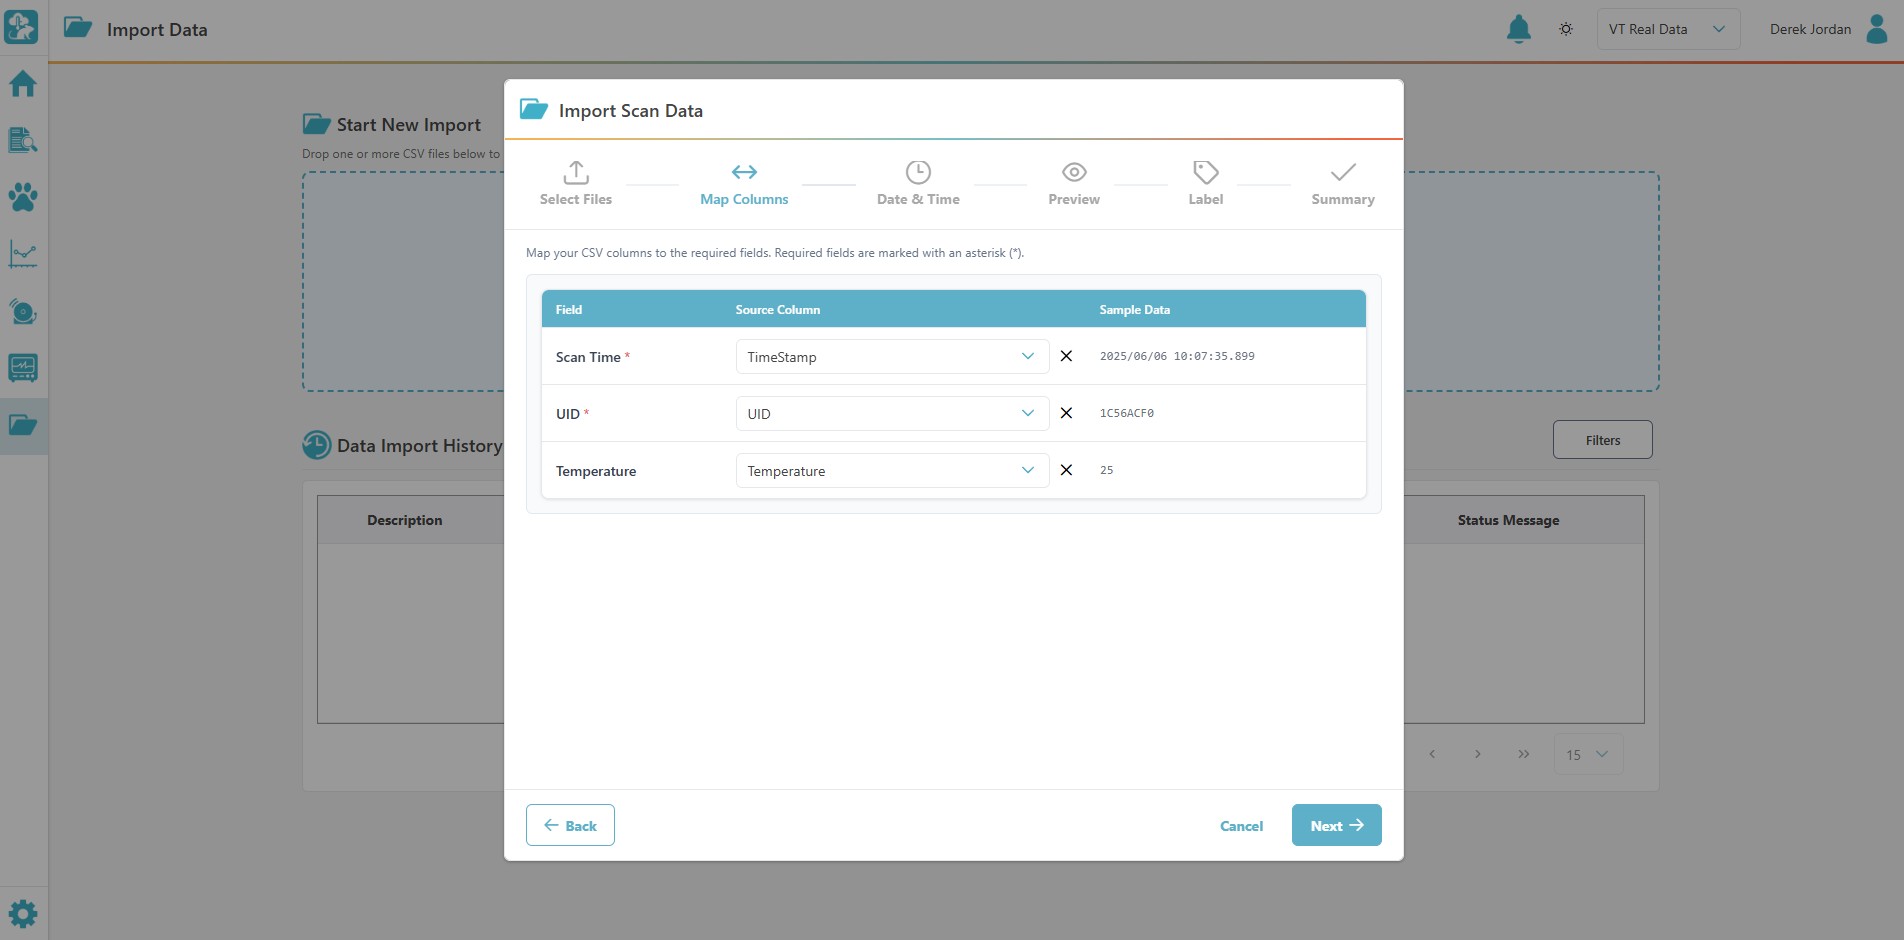
Drop in one or more CSV files, map the columns, and preview the data before importing.
Every Scan Finds Its Animal
A scan means more when you can see the animal behind it. VivoTraq matches scan data to the RFID, keeping identity, temperature trends, studies, and record history together.
- Vitals — First scan, last scan, latest temperature, last location, and total scan count.
- Identity — Species, strain, sex, implant location, and implant method.
- Trends — A temperature chart for that animal, with date-range filtering and chart or table views.
- Studies — Status, group assignment, and the most recent event, like a dosing.
- History — Adds, updates, and bulk updates with an author and timestamp, shown as a table or timeline.
Choose How Data Gets to VivoTraq
The right path depends on whether you need live alerts and whether your lab can keep an uploader connected.
-
Upload as You Scan
Run VivoTraq Connect on a Windows workstation. It sends scans to VivoTraq as they happen while the reader keeps collecting, giving your team live data and real-time alerts.
-
Collect First, Upload Later
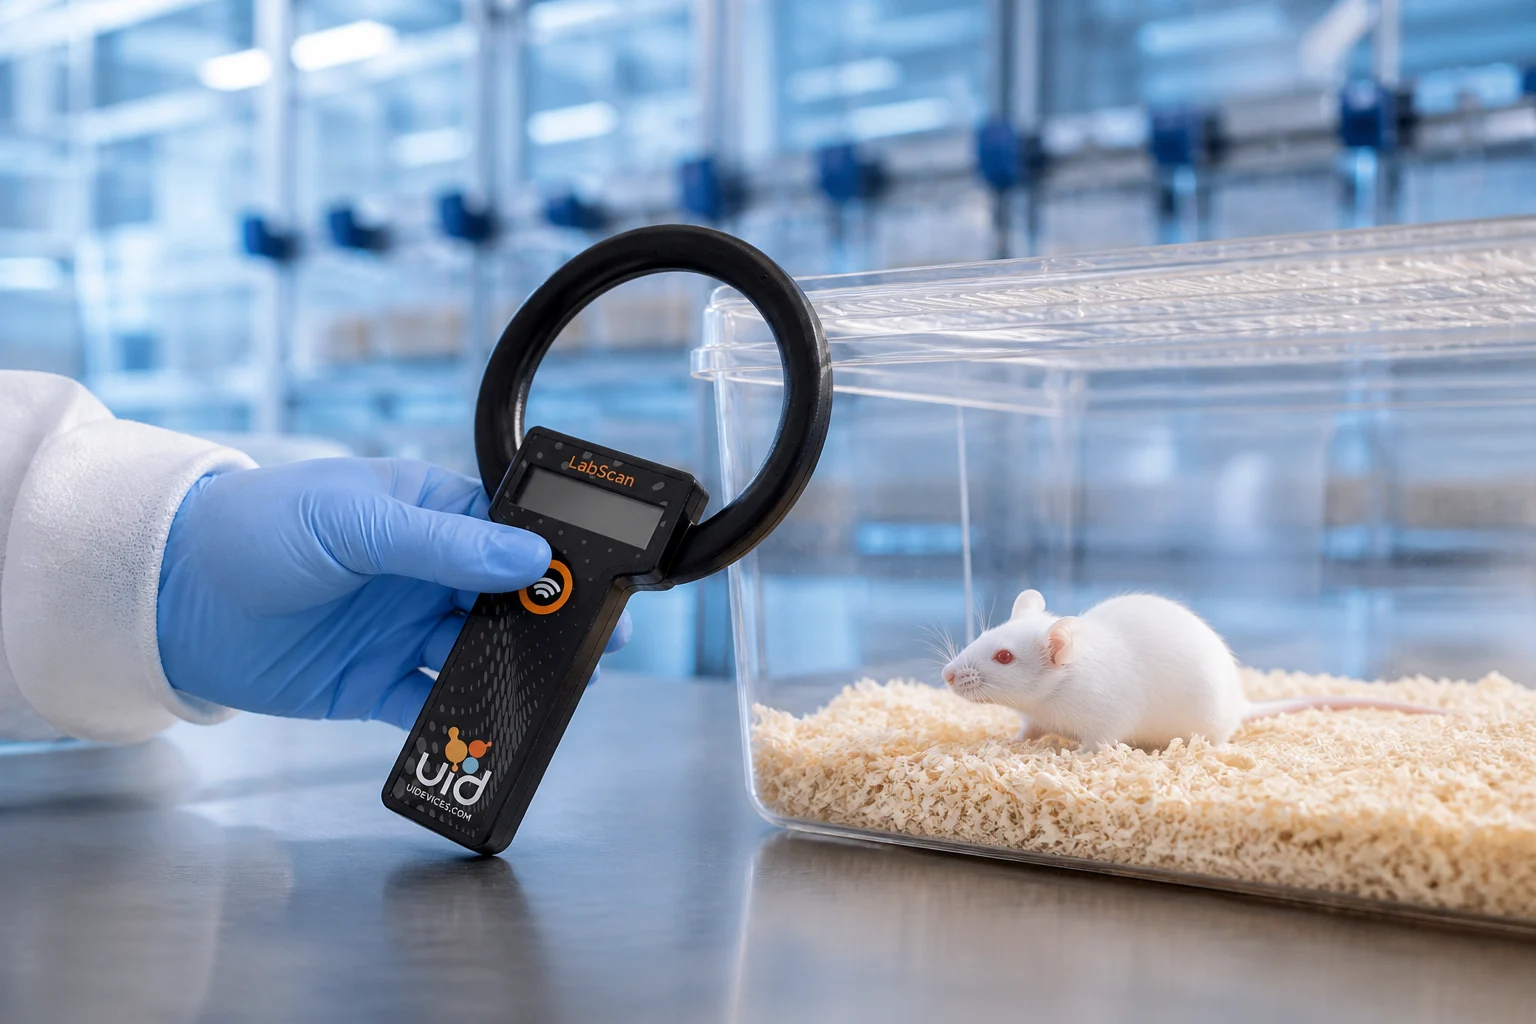
Collect locally with DataCollector or export from an AnyCage+ controller, then upload the file when you're ready. Dashboards, analytics, and history are available after import.
VivoTraq Connect vs VivoTraq Uploads
Both options use the same VivoTraq dashboards and analytics. The difference is whether data arrives automatically as scans happen or after you upload a collected file.
| Feature | Current product: VivoTraq Connect Live data · Real-time alerts | VivoTraq Uploads Local collection · Upload when ready |
|---|---|---|
| How data arrives | Uploaded automatically as scans happen | Collected locally, then uploaded manually |
| Collection software | VivoTraq Connect | DataCollector or AnyCage+ controller |
| Internet during collection | Required for live uploads | Not required during collection |
| Real-time alerts |  |  |
| Live device status | | |
| Audit trail & history | | |
| Dashboards & analytics | Live | After upload |
| IT involvement | Moderate | Low |
Specifications
You'll Likely Also Need
-
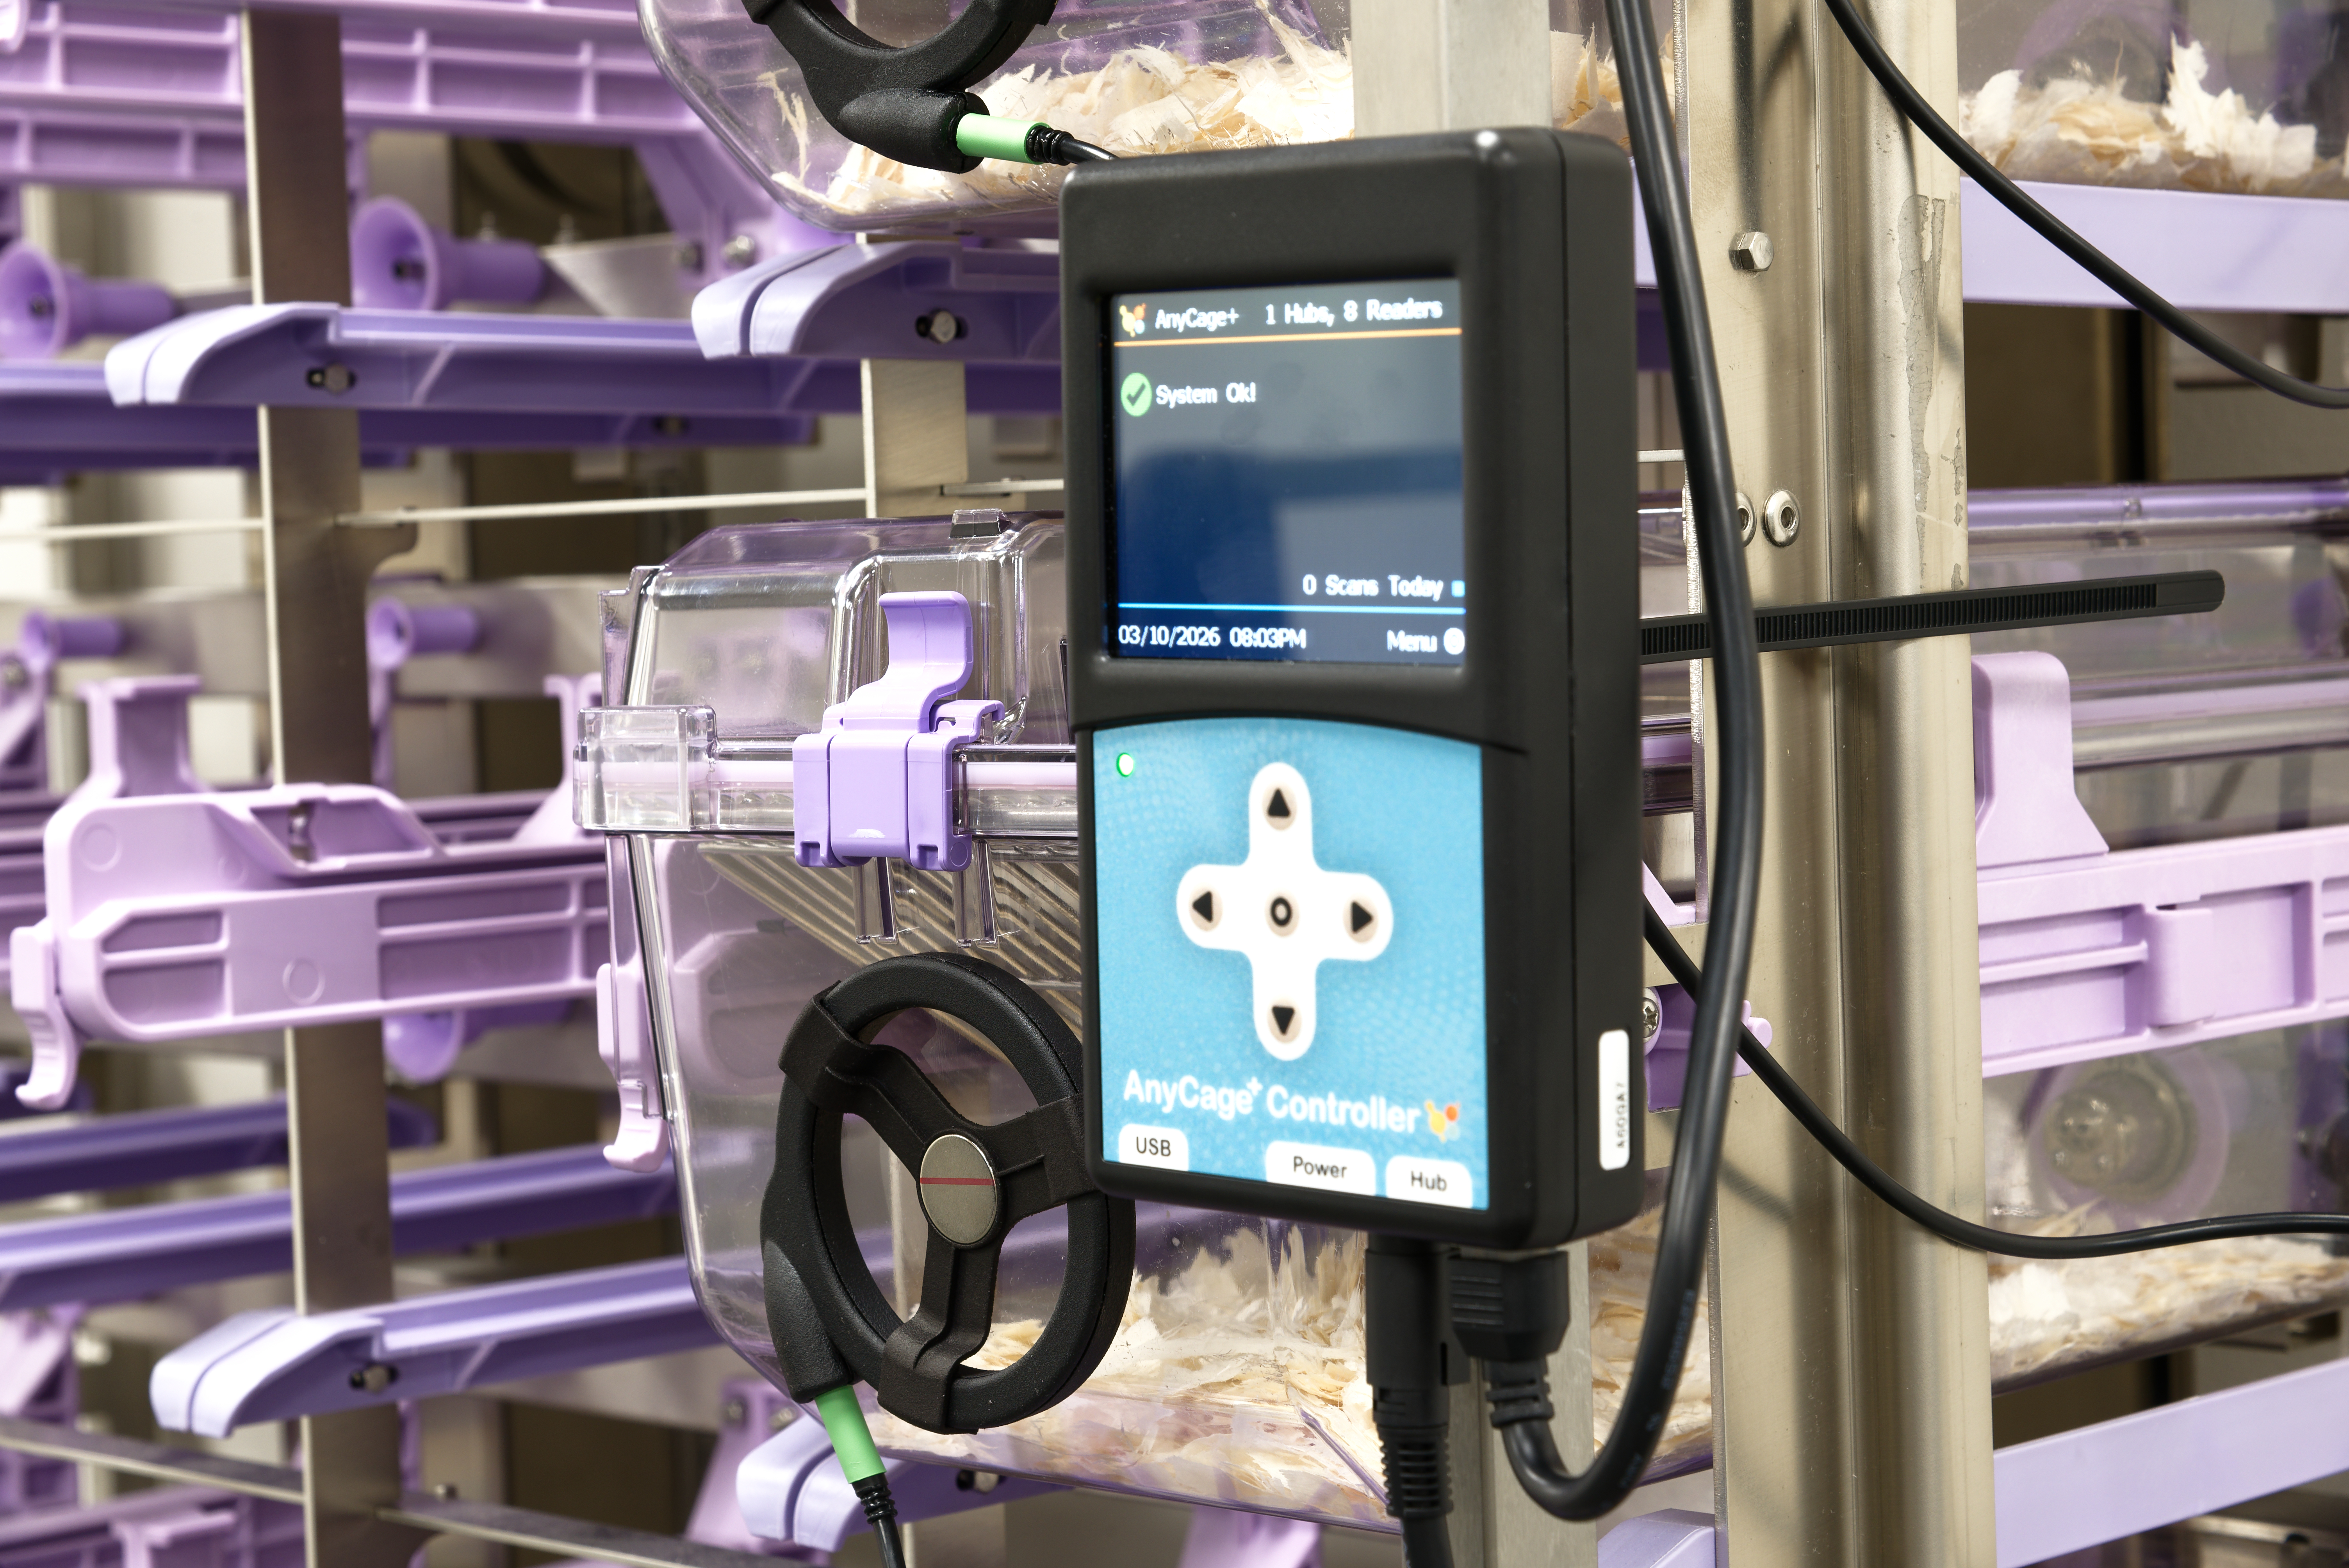 Rack-scale home cage monitoring
AnyCage+
- Home Cage Monitoring
- VivoTraq
Monitor up to 96 cages. Pair with VivoTraq and the UCT-2112 microchip for real-time alerting and continuous temperature monitoring.
View AnyCage+ -
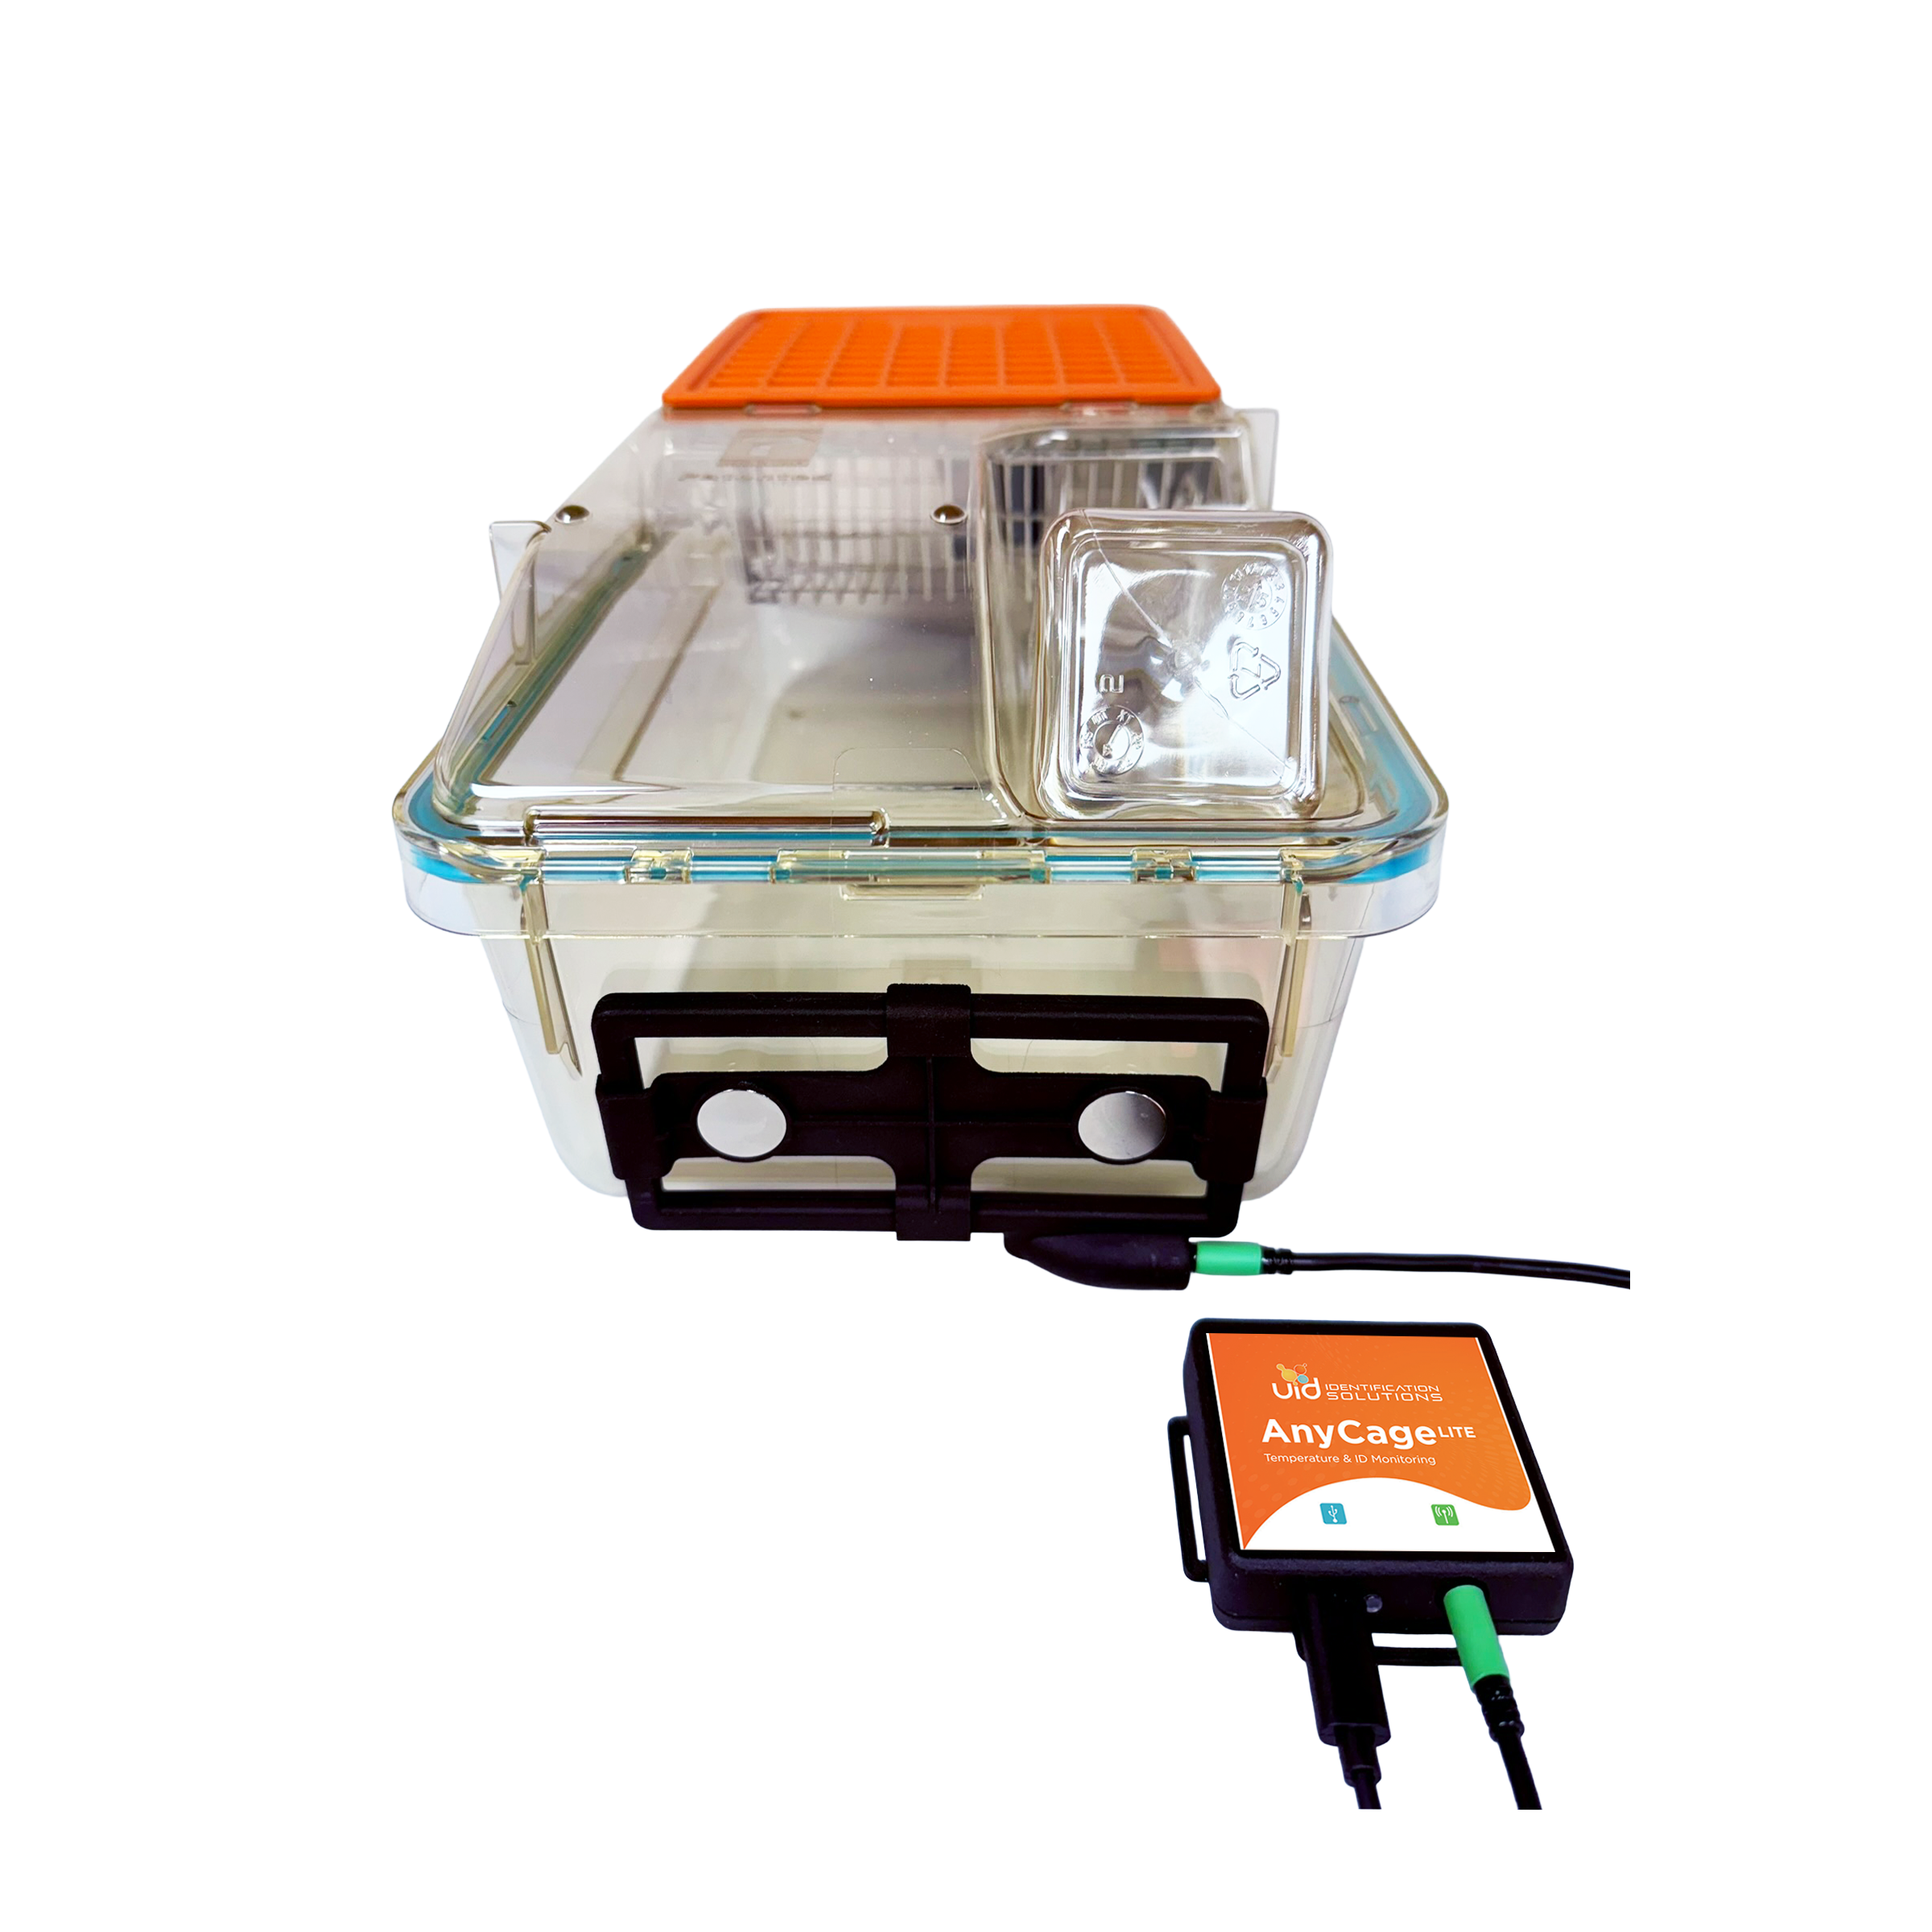 Home cage monitoring
AnyCage Lite Starter Kit
- 4 Readers
- 24 Tags
The home cage monitoring starter kit for AnyCage Lite. Includes everything needed to start monitoring animals in the home cage.
View Starter Kit -
 Temperature
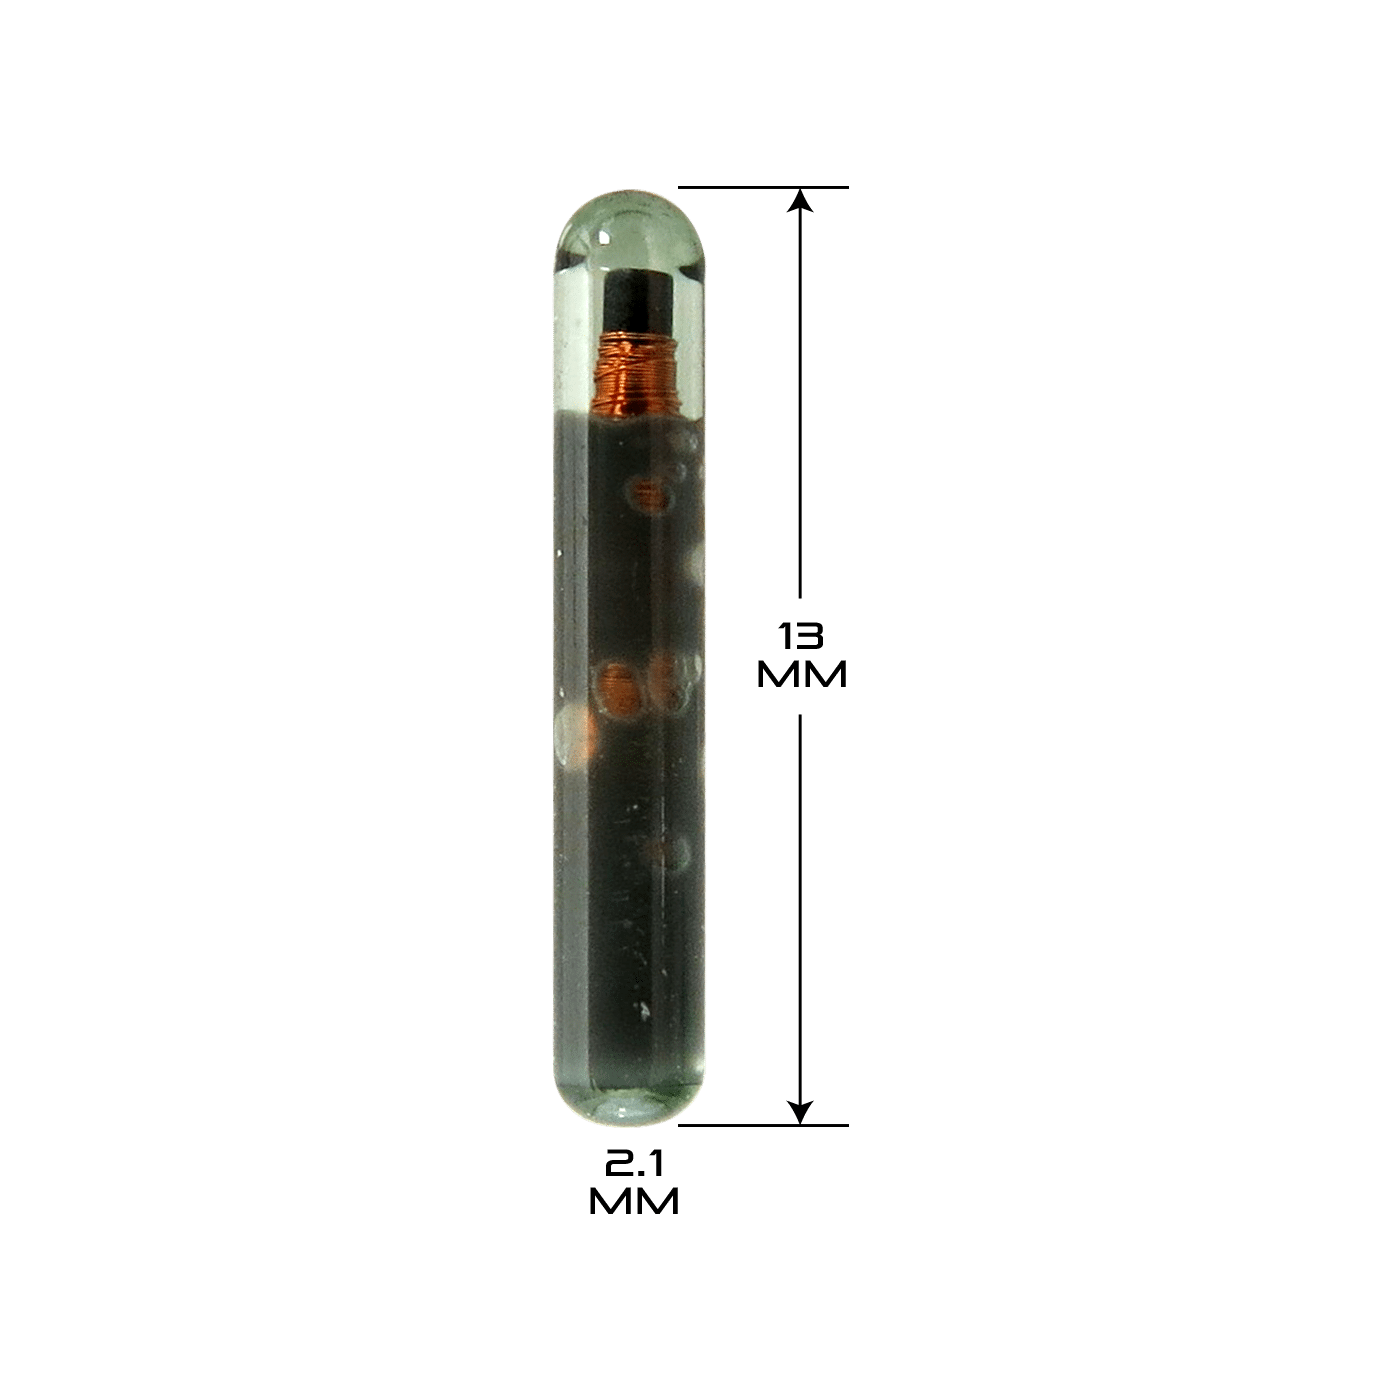
UCT-2112 Temperature Microchip
- Unique ID
- Temperature
- 12.5G
2.1 × 13 mm with a ±0.1 °C temperature sensor. Returns ID and core temperature on the same scan.
View UCT-2112
Common Questions
-
Do we need to install anything?
Not for day-to-day use. VivoTraq Web runs in the browser. Live uploads use VivoTraq Connect on a Windows workstation; manual uploads use files collected with DataCollector or exported from AnyCage+.
-
Our IT team won't approve an always-connected uploader. Can we still use VivoTraq?
Yes. Use VivoTraq Uploads: collect locally with DataCollector or export from AnyCage+, then upload on your schedule. You won't get live alerts or device status during collection, but dashboards, analytics, and history are available after upload.
-
Which UID hardware feeds into VivoTraq?
AnyCage+ and AnyCage Lite are the recommended readers today; Mouse Matrix support is coming soon. Most other UID readers also work with VivoTraq. If you have a specific model, ask us and we'll confirm it.
-
Can our data leave VivoTraq for analysis?
Yes. Export animal data and embedded charts to an Excel workbook. If you need a particular format or a path into your LIMS, tell us what system you use and we'll confirm the options.
Want to see VivoTraq in action?
Tell us which readers you're using and whether you need live alerts. We'll show you the VivoTraq setup that fits your study.