
Live per-animal data for every mouse in the cage.
The Mouse Matrix App turns reader-plate scans into live per-animal temperature, activity, and zone location — the highest-resolution view we offer. Social groups stay intact, with no separation.
- Temperature
- Activity
- Zone location
- Group-housed

See every session, live.
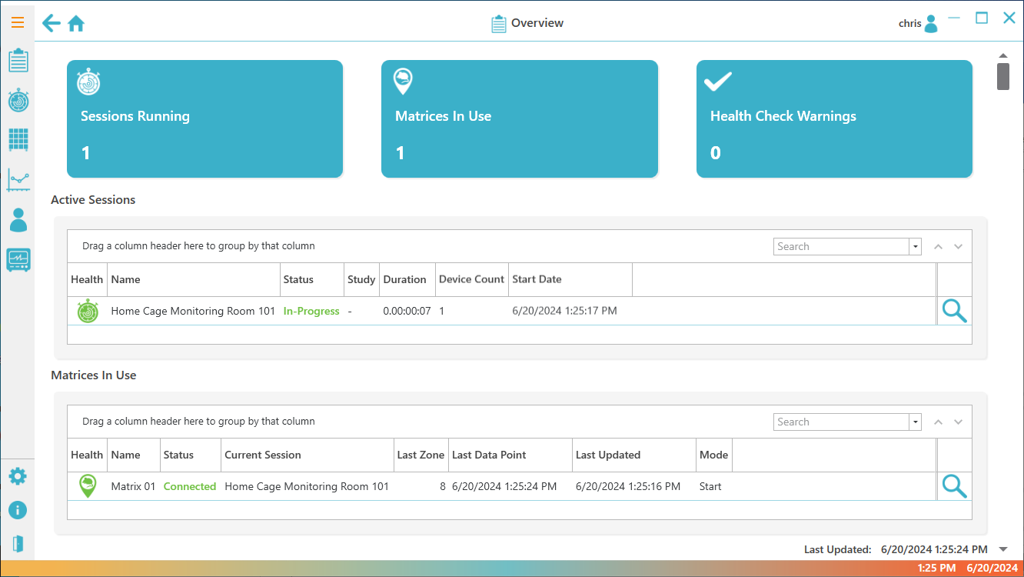
The Overview screen lists every monitoring session running on the system, so you can check any cage without opening a dashboard per plate.
- Per-animal detail Temperature, activity, and zone location for every animal in the cage, not a cage-level average.
- Group-housed Up to five mice tracked individually in the same cage, with social groups left intact.
- Live view Watch animal activity and zone location update as mice move between zones.
- Raw data export Pull the underlying scan data to Excel or CSV whenever you're ready to analyze it.
- 5 Mice tracked per cage
- 100–250 ms Zone scan rate
- 6, 8, 12 Zone plate configurations
What the app gives your study.
Outcomes worded from your side of the cage.
- Handle animals less Temperature, activity, and zone location come from the reader plate — no restraint, no separation, no extra handling events.
- Highest-resolution data Per-animal detail catches what a cage-level average would hide.
- Social groups stay intact Up to five mice are tracked individually in the same cage, with no single-housing artifacts.
- See it live Animal activity and zone location update on screen as mice move, not after the fact.
- Runs through the dark phase No light source is needed, so monitoring continues uninterrupted when rodents are most active.
- Export and move on Raw scan data exports to Excel or CSV, with no separate ingestion step before analysis.
- One chip, one identity Each animal carries a UID UCT-2112 microchip, so its data stays tied to that individual.
- Runs on your desktop The app runs on a Windows workstation connected to the Matrix Controller, with no cloud dependency.
Have a look around the app.
Five screens, switched by you.
Every monitoring session across the system, in one list.
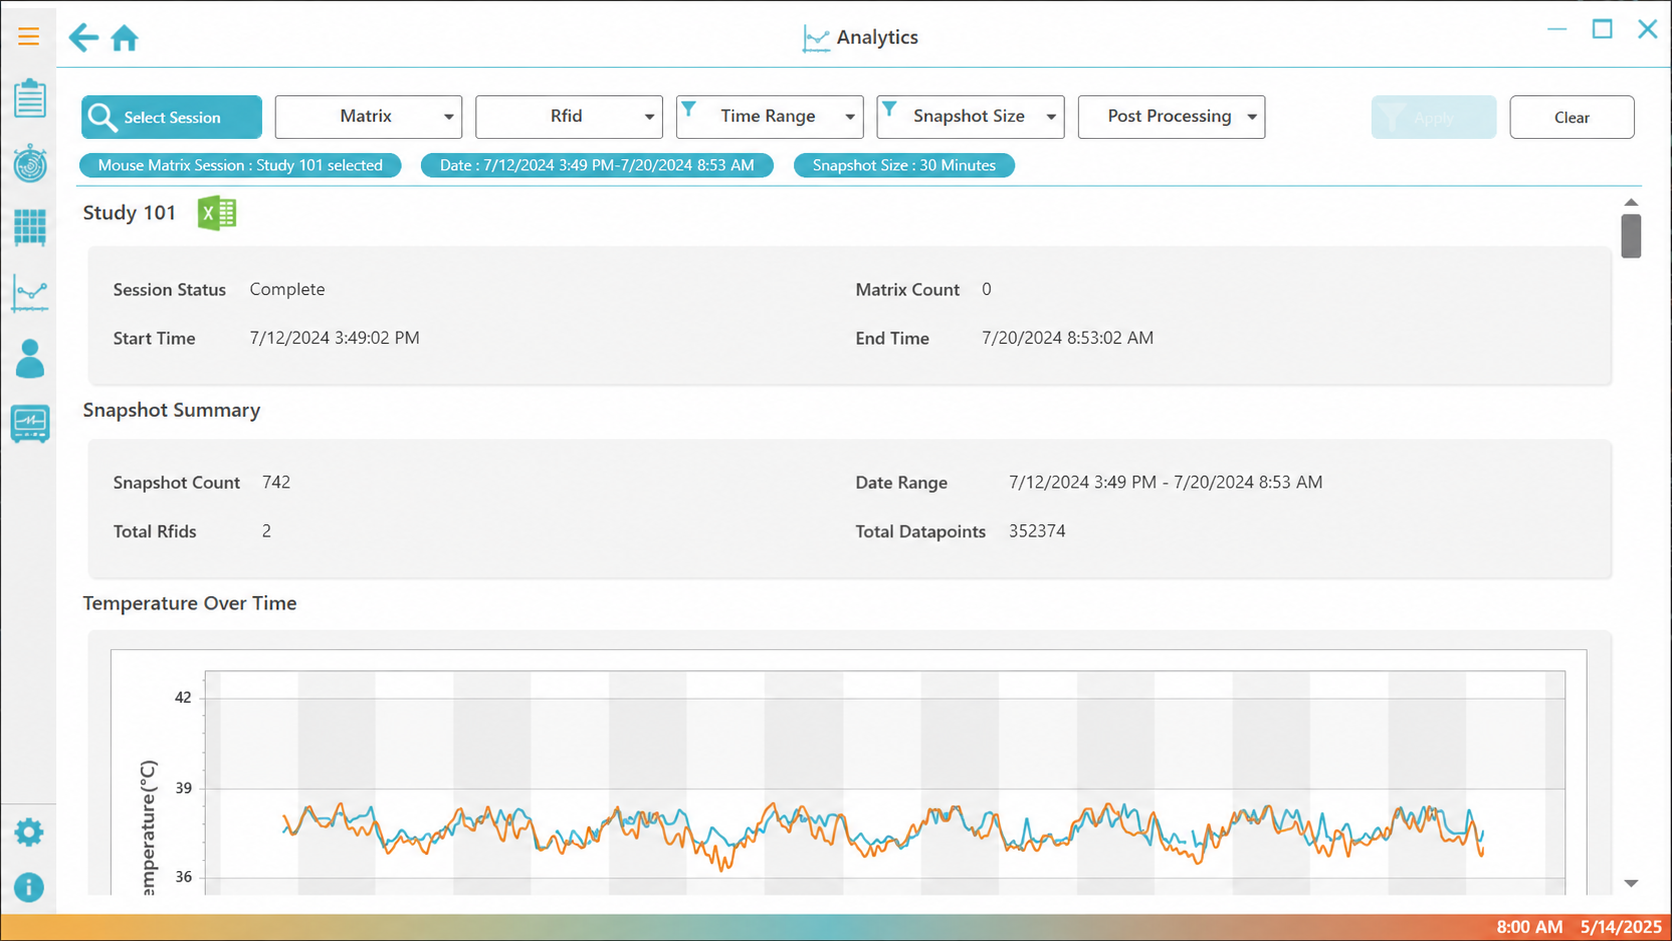
Temperature and activity charted for a group-housed cage over time.
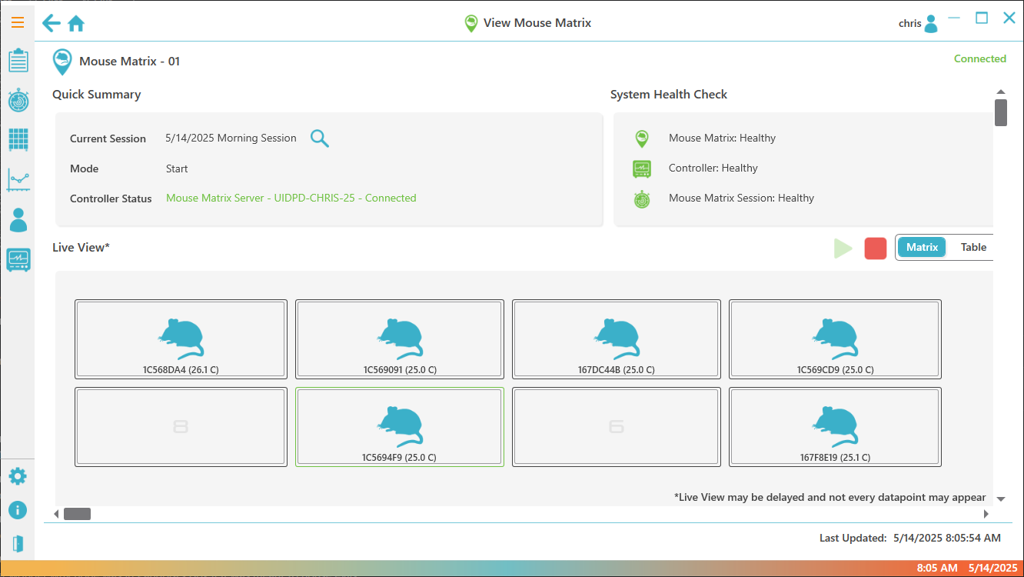
See an individual plate and every animal's current zone.
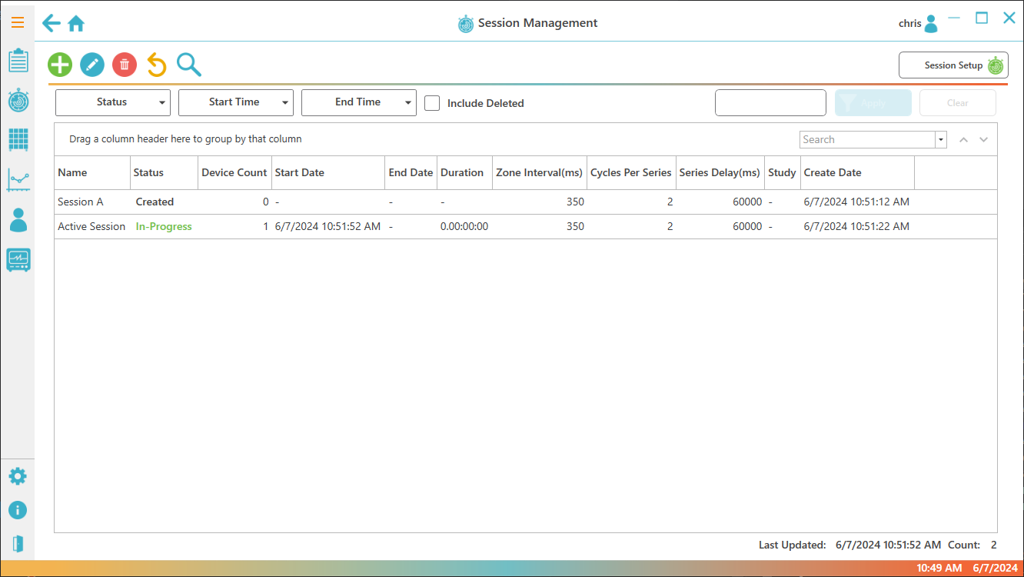
Start, stop, and organize a monitoring session.
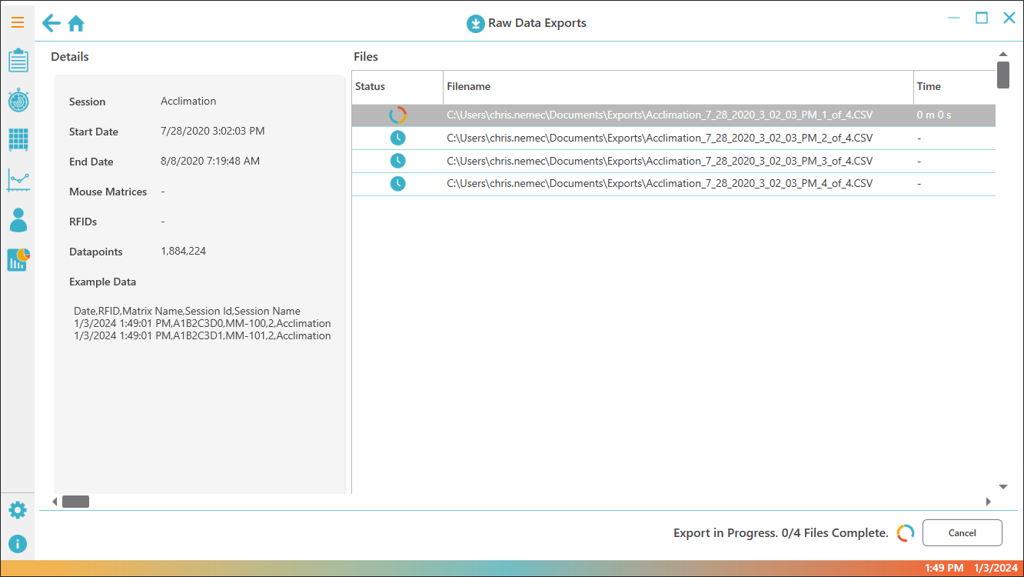
Pull the underlying scan data to Excel or CSV.
Your data, ready for analysis.
Raw Data Export pulls a session's scan data straight out, with no separate ingestion step before it lands in your analysis tool.
- Excel and CSV — Export a session as an .xlsx workbook or a CSV file, whichever your pipeline expects.
- One click — No manual copy-paste from a dashboard; the export button does the work.
- Every scan, per animal — Temperature, activity, and zone location for each animal, time-stamped.
From live scan to exported file.
One straightforward flow, screen to screen.
-
Start a session
Set up a monitoring session in Session Management, then let the reader plates start scanning the cage.
-
Watch it live
Open View Matrix to see current animal locations on the plate, or Overview for a list of everything running.
-
Check the analytics
Analytics charts temperature and activity for the group-housed cage as data comes in.
-
Export when you're ready
Raw Data Export pulls the scan data to Excel or CSV, per animal, time-stamped.
Mouse Matrix App vs VivoTraq
Both are temperature applications, built for different scopes. Pick by what you need to measure and where you need to see it.
| Feature | Current product: Mouse Matrix App Desktop · Per-animal activity & zone | VivoTraq Cloud · Temperature dashboards |
|---|---|---|
| Runs on | Windows desktop | Any modern browser (cloud-hosted) |
| Data source | Mouse Matrix reader plates | AnyCage+, AnyCage Lite, UID readers |
| Measures | Temperature, activity, zone location | Temperature |
| Group-housed detail | Per-animal zone and activity | Temperature only |
| Access | Single workstation | Multi-site, any browser |
| Export | Excel (.xlsx), CSV | Excel (.xlsx) |
| Microchip | UID UCT-2112 | UID UCT-2112 |
| Best for | Per-animal activity and zone in one cage | Rack-scale temperature across sites |
Specifications
You'll likely also need
-
 Hardware
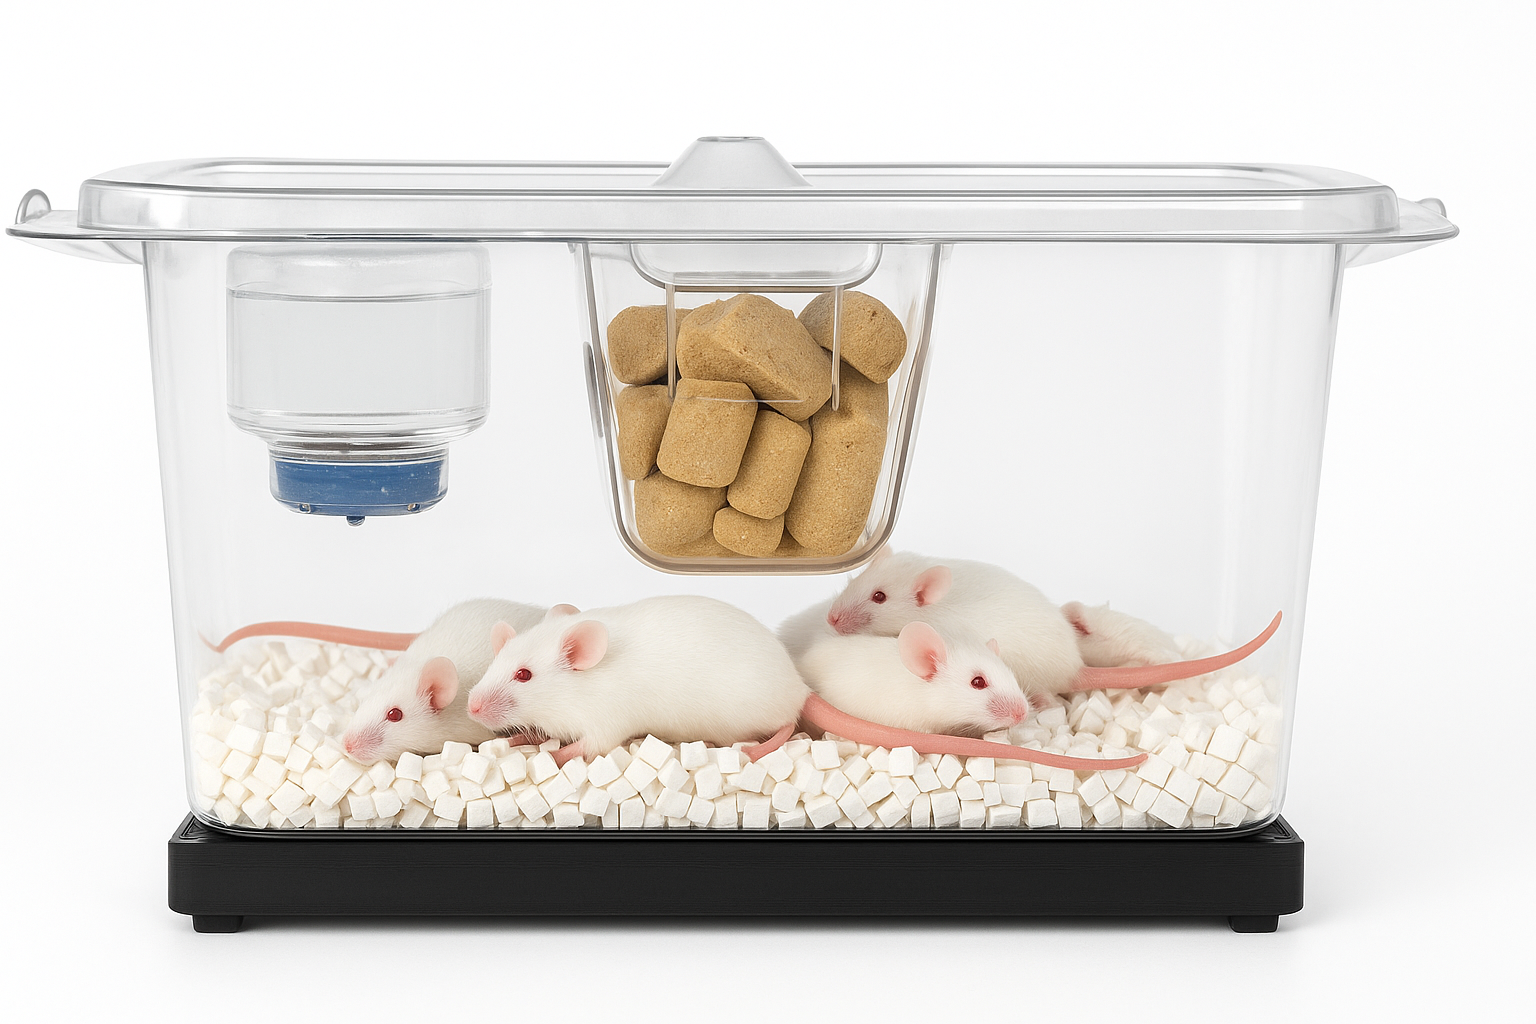
Mouse Matrix
The reader plates and controller the app runs on — per-animal temperature, activity, and zone location for up to 5 group-housed mice per cage.
View product → -
 Microchip
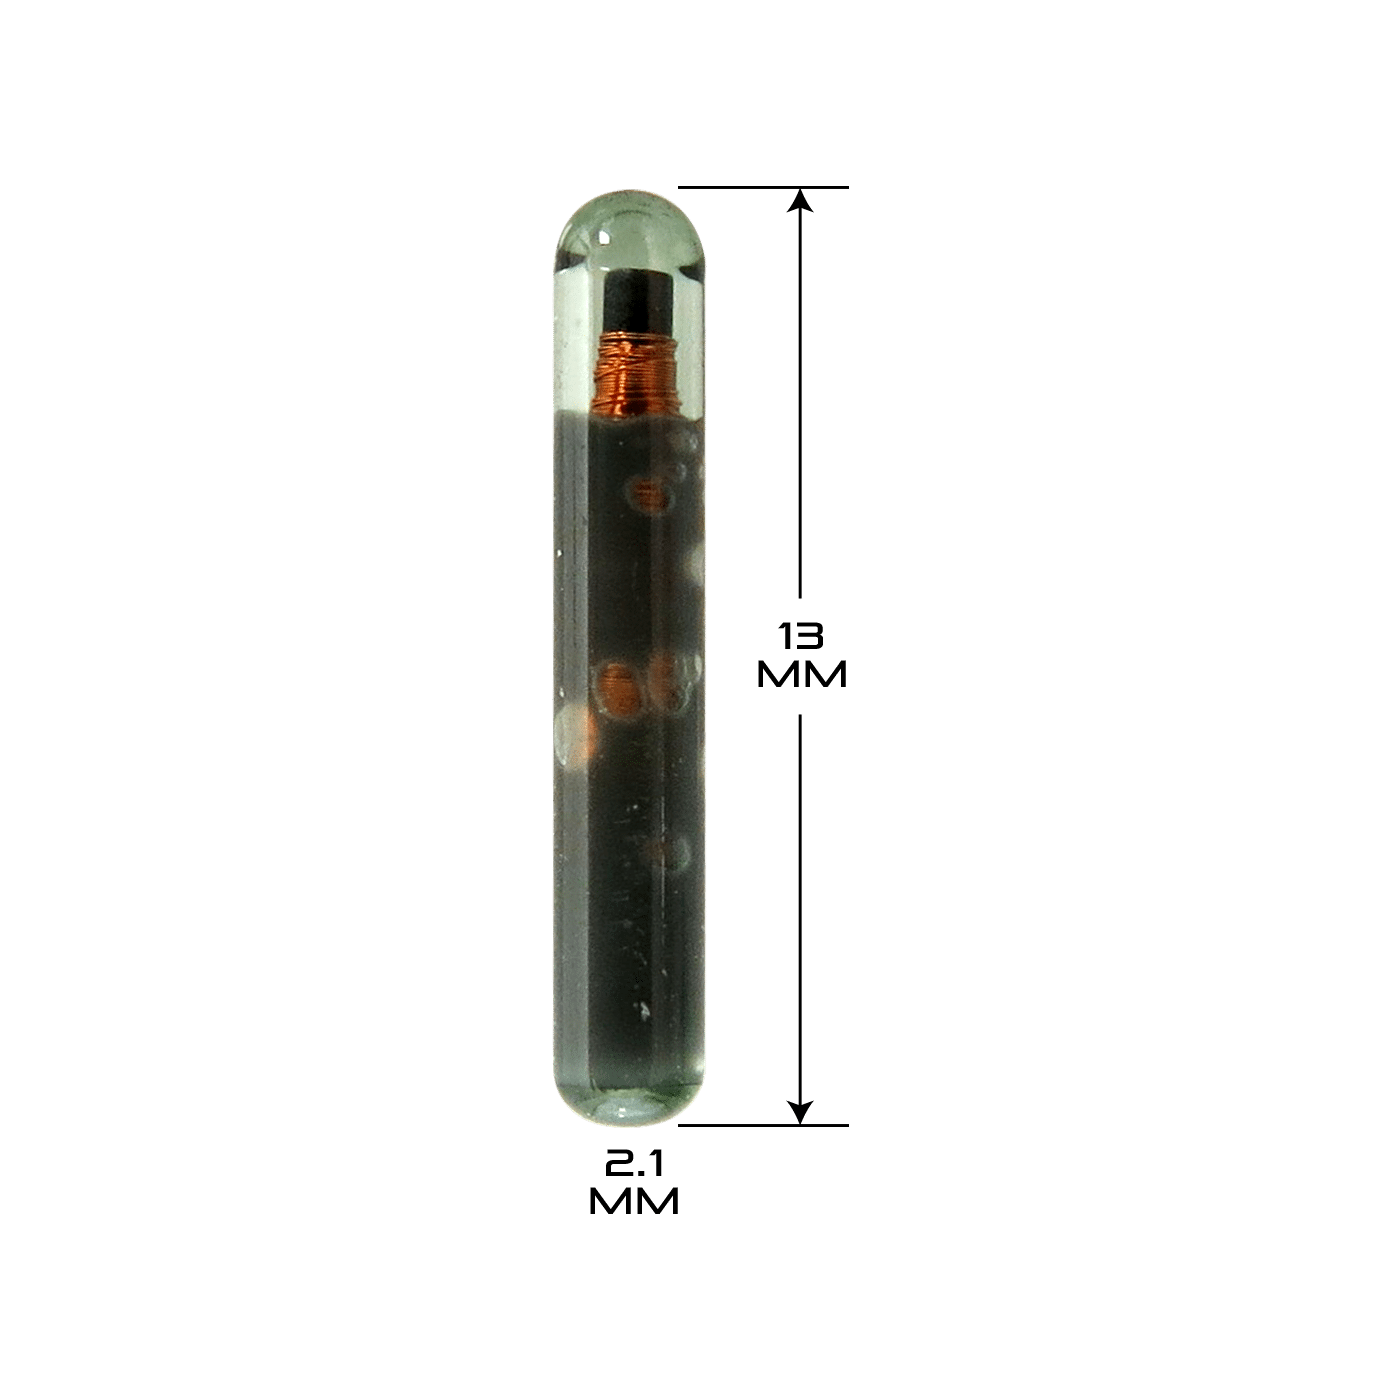
Temperature Microchip — UCT-2112
Implantable temperature transponder with a unique ID. ±0.1 °C accuracy @ 38 °C across 30–46 °C, 134.2 kHz, no battery.
View product → -
 Related product
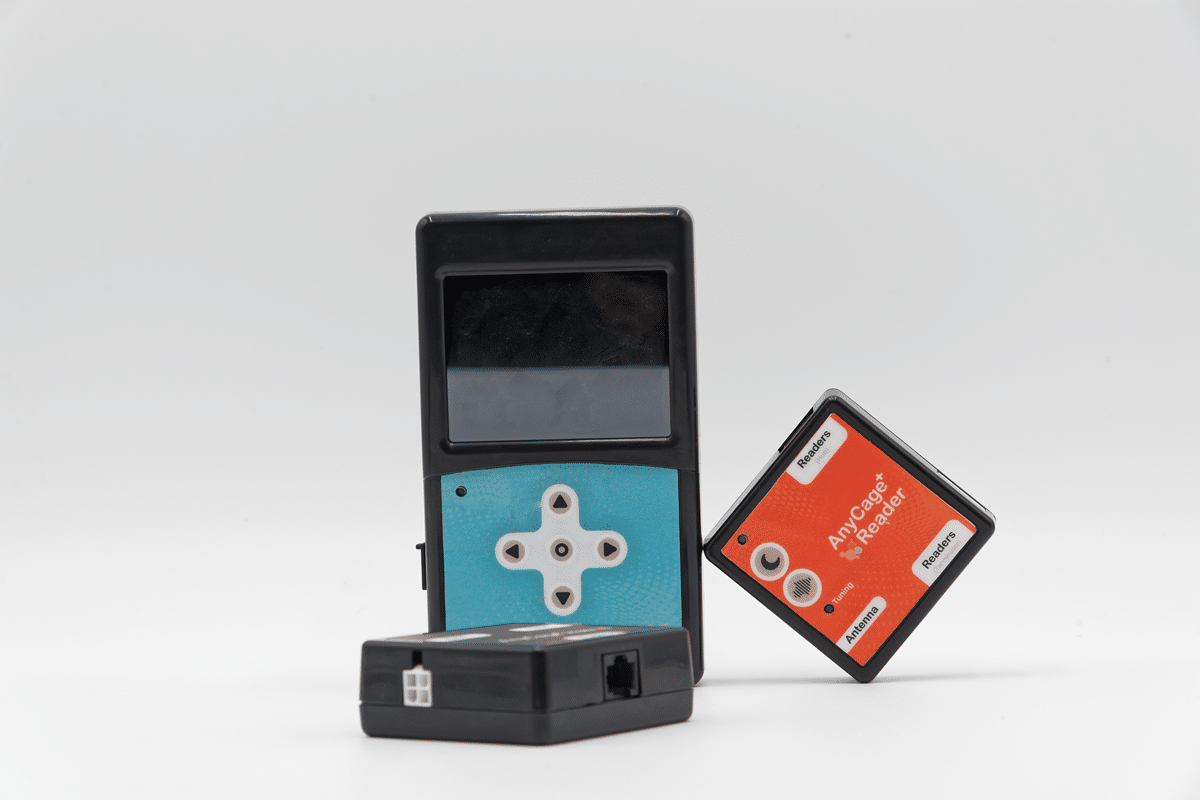
AnyCage+
Continuous, per-animal temperature across the whole rack — no handling, no cage opens, no per-cage PC.
View product →
Common questions
-
Does the app need the Mouse Matrix hardware?
Yes. The Mouse Matrix App runs on a Windows desktop connected to the Matrix Controller, which manages the reader plates under each cage — it's not a standalone analytics tool. See Mouse Matrix for the hardware side.
-
Which microchip does it read?
The UID UCT-2112 temperature-sensing microchip. The same chip is used across AnyCage Lite, AnyCage+, and Mouse Matrix, so an implanted animal keeps its identity if it moves between systems.
-
What formats can we export?
Excel and CSV. Raw Data Export pulls a session's scan data straight out, with no separate ingestion step.
-
How is this different from VivoTraq?
Different scope. VivoTraq is a cloud dashboard for AnyCage and UID reader temperature data; the Mouse Matrix App is the desktop software for Mouse Matrix's per-animal temperature, activity, and zone location. The comparison above has the details.
-
Do the mice need to be separated to get per-animal data?
No. Mouse Matrix tracks up to five group-housed mice per cage individually, so social groups stay intact.
Ready to see per-animal data from your own cages?
Tell us about your protocol and cage setup, and we'll walk through the Mouse Matrix App alongside the hardware it runs on.